

Given the 8 on ground spots that we have to field this year, there are many and varied options in how people are looking at building their starting Mids.
This article is not going to talk structure or preferred strategy, but simply present the facts on the year that was and look broader than averages.
I have focussed on the 14 most talked about Mids (Barring Gaz or Swan, as we all know their capabilities)
Hopefully it can provide a guide on who will make up your starting squad and continue the banter around “My Midfield is better than yours”
I will assign a points value based on how that player ranks. 1 point for 1st, down to 14 points for 14th rank. At the end of the article, I will rank players based on those points. Obviously this is subjective on the way that I have chosen to measure them, but you will get a guide.
The first question that we generally need to ask ourselves is are we looking for consistency or ceiling?
Do you want the guy who pumps out 110 week on week or the guy that will give you 140, followed by 2 90’s? Only you can answer that.
Consistency
You want your Mids scoring 110+ I reckon, so I have looked at 2012 and shown how often these guys have scored over 100, then also % of total games that they score over 100 and over 110.

I also looked at what I call their “Purple Patch” the number of games in succession that they score over 100 and their average over that time:

Now some of these players have had multiple spurts of consecutive games over 100, where that has happened, I have taken the higher average.
Last measure of consistency is Standard Deviation… this is a fairly standard statistical measure, that in layman’s terms looks at the variance between highest and lowest scores (its more complex than that, but you get the gist).
For this the lower number is the better, however Std Dev can be deceiving as if a players floor (lowest score) is 100 and their ceiling (Highest Score) is 155 you would probably be happy with a high std dev, so I think it is important to also look at their % of time they score under 100. I have then multiplied these 2 figures to get what I call an Acceptable Std Dev.

So from a consistency perspective those are the measures that I look at.
Ceiling
Now let’s look at ceiling… When they go BANG…. how Big do they Bang!!
Now I am greedy.. I see 125 as a very nice score, anything above that is just damn well tasty, so firstly let’s look at the number and % of times they score over 125.

How big can they bang though… this is particularly good to look at, if you are one of those crazies that isn’t looking at starting with either Gazza or Dane.

Coming Home
Now let’s look at how these guys finished 2012.
There is a correlation in finish to the year and going bang the next year…Both Beams and Cotchin’s 2012 years are testament to that. So who came home with a wet sail?

Starting with a BANG!
How does there 2013 draw stack up?
Are they better to start or to upgrade too?
I have looked at the teams they play prior to their bye and used their scores from 2012 to determine a rough average (this is obviously assuming they score the same, not allowing for any improvement or decline, having said that it still gives a good guide.

DT Spread
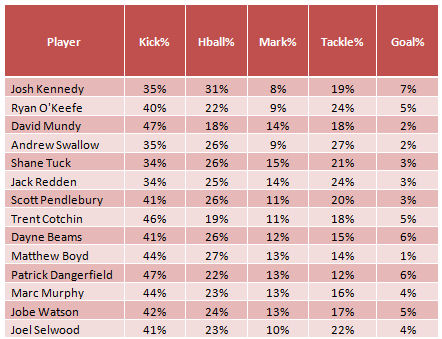
So lastly I thought that it would be good to look at how these guys get their points… doesn’t really tell us much, apart from the fact that there are a few players who get around 1/5th of their points from tackles, meaning that they score well when the ball is not in their hands, if they can keep that work rate and up the possession…who knows.
Anyway, the point spread looks like this:
Ranking
So there we are. All of the above does not take into account, role change in team, competition for the pill and a million other things but gives you a bit of a stat breakdown and a snapshot into the world of Rainman.
Now bear in mind I have attributed no weighting to any of the below measures. I.e is ceiling more important than consistency.
This also puts a bias against injured players (Pendles, Murph) given the games back from injury and getting back up to speed etc. A better indication on potential for these guys would be to include 2011 in the stats as well, but you can look that up yourself J
Based on all of the above, I rank them as follows:

Anyway, I am sure that this will open some debate, after all that is what it is for.
Cheers
Rainman

Podcasts


Calvin's Captains
Calvin’s Captains – Rd. 19

Team Sheets
AFL Teams 2025: Round 19


The Thursday Scramble
The Thursday Scramble: Round 19

Cal's Scale of Hardness
Cal’s Scale of Hardness – Rd. 15

Cash Cows
Fry’s Cash Cows – Rd. 16
Cash Cows
Fry’s Cash Cows – Rd. 17
Calvin's Captains
Calvin’s Captains – Rd. 18


Recent Comments